


Analysis of System Noise Coefficients in Modern Radio Receivers
Time:2023-10-22
Views:526
This tutorial first examines the basic definition of noise figure, then proceeds with equation based analysis of cascaded modules involving mixers, and then introduces typical laboratory techniques for measuring noise figure. System and design engineers typically use noise figure to ensure signal performance. However, using mixers in the signal chain poses challenges for simple noise figure analysis.
Summary: System and design engineers typically use noise figure to ensure signal performance. However, using mixers in the signal chain poses challenges for simple noise figure analysis. This tutorial first examines the basic definition of noise figure, then proceeds with equation based analysis of cascaded modules involving mixers, and then introduces typical laboratory techniques for measuring noise figure. Before exploring the use of the Y-factor method for mixer noise figure measurement, this tutorial also introduced the concepts of noise temperature and Y-factor noise measurement. Discussed examples of noise figure measurements for double sideband (DSB) and single sideband (SSB).
brief introduction
The general concept of noise figure has been fully understood and widely used by system and circuit designers. In particular, it is used to convey the noise performance requirements of product definers and circuit designers, and to predict the overall sensitivity of the receiver system.
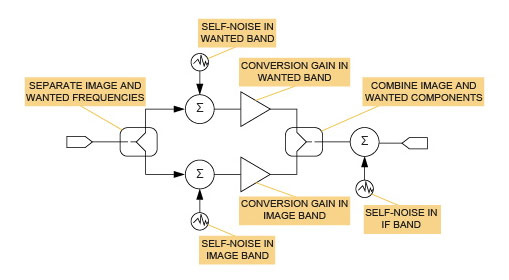
When the mixer is part of the signal chain, the main difficulty in noise figure analysis arises. All actual mixers will fold the RF spectrum around the local oscillator (LO) frequency, creating an output containing the sum of the two side spectra based on fOUT=| fRF – fLO |. In heterodyne architecture, one of these contributions is often considered false, while the other is considered intentional. Therefore, image rejection filtering or image cancellation schemes may be used to largely eliminate one of these responses. In direct conversion receivers, the situation is different; Both sidebands (above and below fRF=fLO) are converted and used for the desired signal. Therefore, this is indeed a dual sideband (DSB) application for mixers.
Various definitions commonly used in the industry explain noise folding to varying degrees. For example, the traditional single sideband noise coefficient FSSB assumes that noise from both sidebands can be folded into the output signal. However, only one sideband can be used to transmit the required signal. Assuming that the conversion gains of two responses are equal, this naturally leads to an increase in noise figure of 3dB. On the contrary, the DSB noise figure assumes that both responses of the mixer contain some useful signals, so noise folding (and corresponding signal folding) will not affect the noise figure. DSB noise coefficient can be applied to direct conversion receivers and radio astronomical receivers. However, deeper analysis suggests that designers simply choose the correct noise figure "style" for a given application and then substitute the corresponding numbers in the standard Friis equation is not enough. Doing so may lead to serious errors in the analysis, especially when the mixer or components behind the mixer play an undeniable role in determining the system noise figure.
|
Disclaimer: This article is transferred from other platforms and does not represent the views and positions of this site. If there is any infringement or objection, please contact us to delete it. thank you! |


 Business consulting

 13823761625
 Mail me