


ADC needs to consider intermodulation distortion factors
Time:2024-02-20
Views:209
brief introduction
Intermodulation distortion (IMD) is a commonly used metric to measure the linearity of amplifiers, gain modules, mixers, and other RF components. The second-order and third-order intermodulation cutoff points (IP2 and IP3) are the quality factors of these specification parameters, which can be used to calculate the distortion product at different signal amplitudes. Although RF engineers are very familiar with these specifications, they often encounter some confusion when using them for ADCs. This tutorial first defines intermodulation distortion within the framework of ADC, and then points out some preventive measures that must be taken when applying the definitions of IP2 and IP3 to ADC.
Double tone intermodulation distortion (IMD)
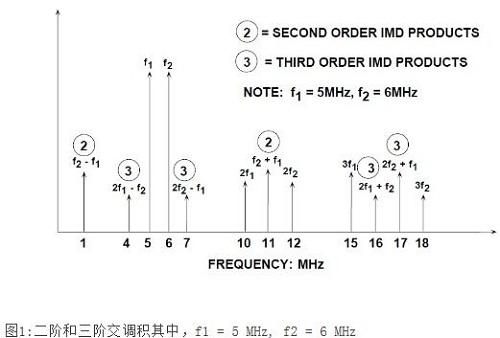
When measuring the distortion of dual tone intermodulation, two pure sine waves in the frequency spectrum should be applied to the ADC at frequencies f1 and f2, which are generally relatively close in distance. Set the amplitude of each tone to be lower than the full range, slightly exceeding 6dB, so that when the phase of the two tones increases, the ADC will not experience clipping. The positions of the second-order and third-order products are shown in Figure 1. Please note that the second-order product is at a frequency position that can be eliminated by a digital filter. However, the third-order products 2f2-f1 and 2f1-f2 are closer to the original signal, making filtering more difficult. Unless otherwise specified, double tone intermodulation distortion refers to these "close range" third-order products. The cross tone distortion product is generally measured in dBc, relative to the value of one of the two original tones, rather than the sum of the two.
However, please note that if two tones are close to fs/4, the aliased third harmonic of the fundamental wave may make it exceptionally difficult to identify the true product of 2f2-f1 and 2f1-f2. The reason is that the third harmonic of fs/4 is 3fs/4, and aliasing occurs at the frequency of fs-3fs/4=fs/4. Similarly, if two tones are close to fs/3, aliasing second harmonic may interfere with the measurement. The principle is the same as above, the second harmonic of fs/3 is 2fs/3, and aliasing occurs at fs-2fs/3=fs/3.
Second and third order intermodulation cutoff points (IP2, IP3), 1-dB compression point
The product of third-order intermodulation distortion is particularly troublesome in multi-channel communication systems, where channel isolation remains unchanged throughout the entire frequency band. The third-order intermodulation distortion product may mask small signals in the presence of large signals.
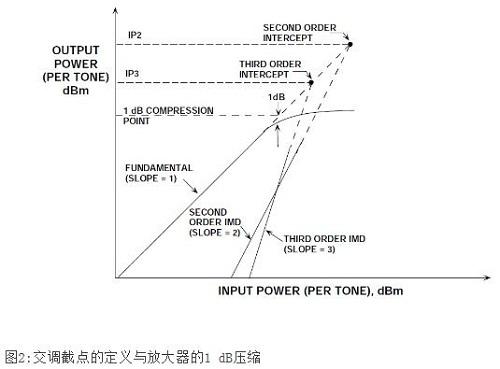
In amplifiers, mixers, and other RF components, the third-order intermodulation distortion product is generally represented by the third-order intermodulation cutoff (IP3), as shown in Figure 2. Two pure frequencies of sound are applied to the system. The output signal power of a single tone (in dBm) and the relative amplitude of the third-order product (based on a single tone) are expressed as functions of the input signal power. The fundamental wave is represented as the slope=1 curve in the graph. If the nonlinearity of the system is approximated through power series expansion, for every 1dB increase in the signal, the amplitude of the second-order IMD (IMD2) will increase by 2dB, as shown by the slope=2 curve in the figure.
Similarly, for every 1dB increase in the signal, the amplitude of the third-order IMD (IMD3) increases by 3dB, as shown by the slope=3 curve in the figure.
Under a low-level dual tone input signal and two data points, second-order and third-order intermodulation distortion lines can be drawn, as shown in Figure 2 (the principle is that a point and a slope define a straight line).
However, once the input signal reaches a certain level, the output signal will begin to be soft limited or compressed. One relevant parameter here is the 1dB compression point. This is the point where the output signal is compressed by 1dB from an ideal input/output transfer function. In Figure 2, this point is located in the area between the ideal slope=1 line becoming a dashed line and the actual response showing signs of compression (solid line).
However, both second-order and third-order intermodulation cross-sections can be extended to intersect with the extension line (dashed line) of the ideal output signal line. These intersection points are called second-order and third-order intermodulation cutoff points, respectively, represented as IP2 and IP3. These power level values are usually based on the output power of the device conducted to a matching load (usually but not necessarily 50), represented as dBm
It should be noted that IP2, IP3, and 1dB compression points are all functions of frequency, and as expected, the higher the frequency, the more severe the distortion.
For a given frequency, the approximate level value of the third-order IMD product can be calculated as a function of the output signal level, given the known third-order intermodulation cutoff point.
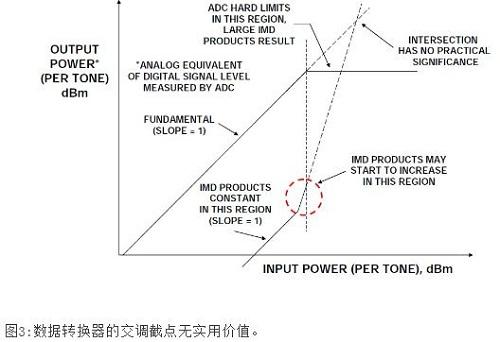
When the input signal is within a few dB of the full range of the ADC, IMD may begin to increase (but this may not be the case in well-designed ADCs). The exact level at which this phenomenon occurs depends on the specific ADC - some ADCs do not significantly increase their IMD product within their full range input range, but most ADCs do. When the input signal continues to increase and exceeds the full range, the ADC should act as an ideal limiter, and the IMD product will become very large. For such reasons, ADC does not have rated values for second-order and third-order IMD crosstalk cutoff points. It should be noted that DAC actually has the same situation. In two cases, the rated value of single tone or multi tone SFDR (no spurious dynamic range) is a widely recognized measure of distortion performance in data converters.
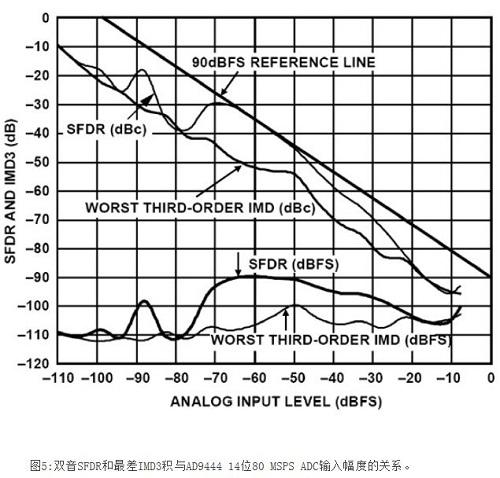
Multi tone, no spurious dynamic range
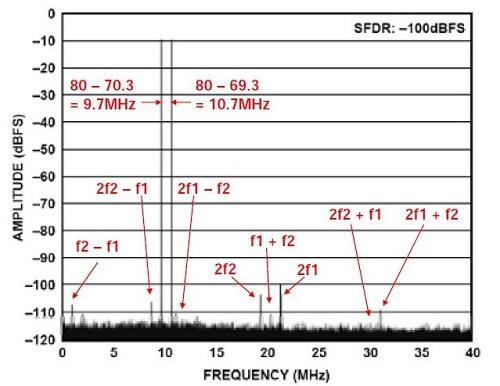
Communication applications typically require measurement of dual tone and multi tone SFDRs. The more signal tones there are, the closer it is to the broadband spectrum of cellular telephone systems such as AMPS or GSM. Figure 4 shows the dual tone intermodulation performance of AD944414 bit 80-MSPADC. The frequencies of the two input tones are 69.3MHz and 70.3MHz respectively, located in the second Nyquist region.
summary
Intermodulation distortion (IMD2, IMD3) and intermodulation cutoff (IP2, IP3) are common specification parameters for RF components such as mixers, LNAs, gain modules, amplifiers, etc. By using power series expansion to simulate the nonlinearity of these devices, the distortion levels of various signal amplitudes can be predicted based on the intersection cutoff points IP2 and IP3. Unlike amplifiers and mixers, ADC distortion (especially low-level signals) is not suitable for simple power series expansion models, therefore, crosstalk cutoff points IP2 and IP3 cannot be used to predict distortion performance. In addition, when the input signal exceeds the full range, the ADC will act as an ideal limiter, while amplifiers and mixers generally act as soft limiters.
Despite these differences, understanding the dual tone IMD performance of ADCs is crucial in communication applications. A better data manual will provide this data for multiple input signal frequencies and amplitudes. In addition, the ADIsimADCTM program can be used to evaluate the performance of various ADCs at specific frequencies and amplitudes required by system applications. The ADIsimADC program serves as a virtual evaluation board and can be downloaded from the ADI website, as well as the latest models for IF sampling ADC. This program is based on the FFT engine and can accurately calculate the SNR, SFDR, and IMD values of single tone and dual tone input signals.
|
Disclaimer: This article is transferred from other platforms and does not represent the views and positions of this site. If there is any infringement or objection, please contact us to delete it. thank you! |


 Business consulting

 13823761625
 Mail me